August Nature Almanac: What's up with our Monsoon?
by Stephen Jones, with Ruth Carol Cushman and Scott Severs
August 2022
When Coloradans talk about our "midsummer monsoon," visitors from India must shake their heads. After all, two or three inches of precipitation over a six-week period hardly compares to the torrents of life-sustaining rain that wash over the Indian subcontinent each summer.
But the mechanism is similar. In our case, southerly winds bring warm, moisture-laden air up from the Pacific and Gulf coasts, creating towering thunderstorms over our mountains. Some areas of the central Rockies may receive more summer thunderstorms than anywhere else in the northern hemisphere. However, when these thunderstorms rumble out over the foothills, lower humidity and downslope winds tend to drain them of their strength. During this past July, south Boulder witnessed an impressive 29 thunderstorms (defined as a trace or more of rain accompanied by audible thunder), but these storms dropped a total of less than 3 inches of rain.

Summer rainbows over Shanahan Ridge. Photo by Stephen Jones.
Some observers have noted that the drier thunderstorms seem to be growing more prevalent, leading to desiccation of grasses and shrubs that fuel late summer wildfires. Others argue that the patterns we are seeing in the monsoonal thunderstorms are just random variation typical of our erratic mid-continental climate.
Unfortunately, the transient nature of official Boulder weather data makes it difficult to generalize about long-term precipitation trends. The Boulder weather station has been at its current location at the National Institute of Standards and Technology (NIST) for just 32 years. Previous locations included the University of Colorado campus and the roof of a downtown fire station. The first decade after the new station at NIST was established may have been anomalous, since it appears to have been Boulder's wettest decade since official weather observations began in 1897.
Let’s take a look at the available data and see if anything stands out. We start with mean annual precipitation in inches by decade from the 1890s to the 2010s. This graph shows a data point for each decade and a regression line with the overall trend.

This graph suggests a subtle increase in annual precipitation, with the two wettest decades occurring after the weather station was moved a little closer to the mountains.
Now let’s focus on just the summer precipitation at only the NIST weather station?

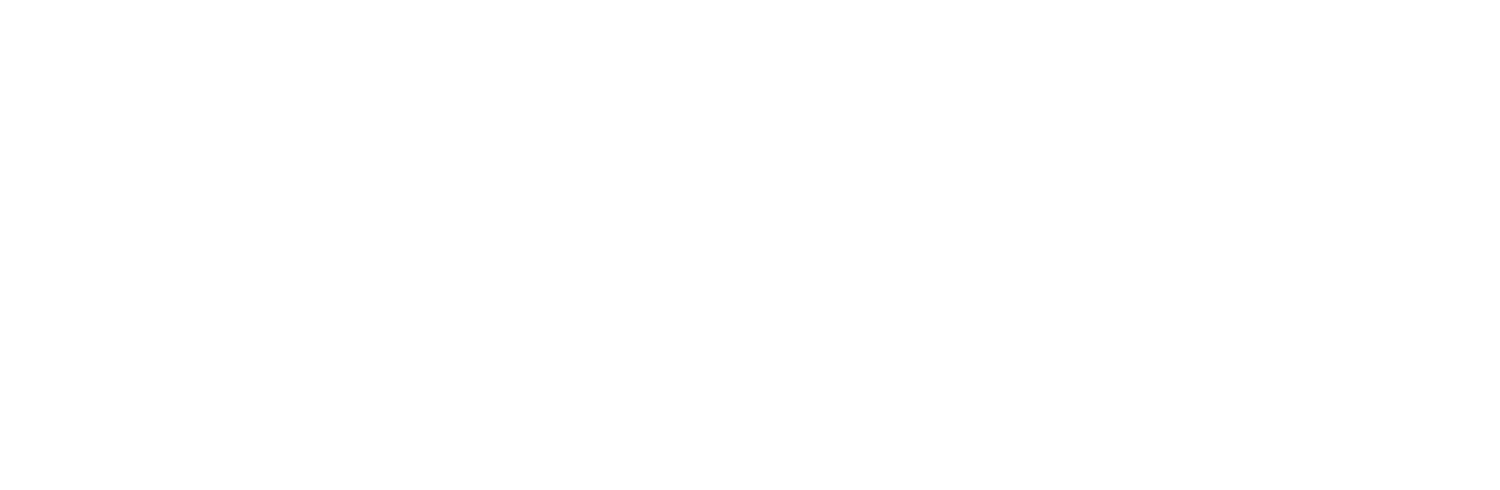
This graph suggests a modest decline from the unusually wet conditions during the 1990s to closer-to-average conditions during the 2000s and 2010s. Now let's zoom in a little closer to the time of the year when the monsoonal flow tends to be strongest.
One observation that stands out in the graph above is the five monsoonal periods during the 1990s when Boulder received at least 4 inches of rain. Since 2000, there have been only two monsoonal periods with more than four inches of rain. We searched through the summer weather records from 1897-1989 to determine the average. We found that the average is only one wet (>4 inches) monsoonal period per decade, equivalent to what we've experienced during the last two decades. Though total July-August precipitation amounts per decade have vacillated up and down, we found no long-range trend.
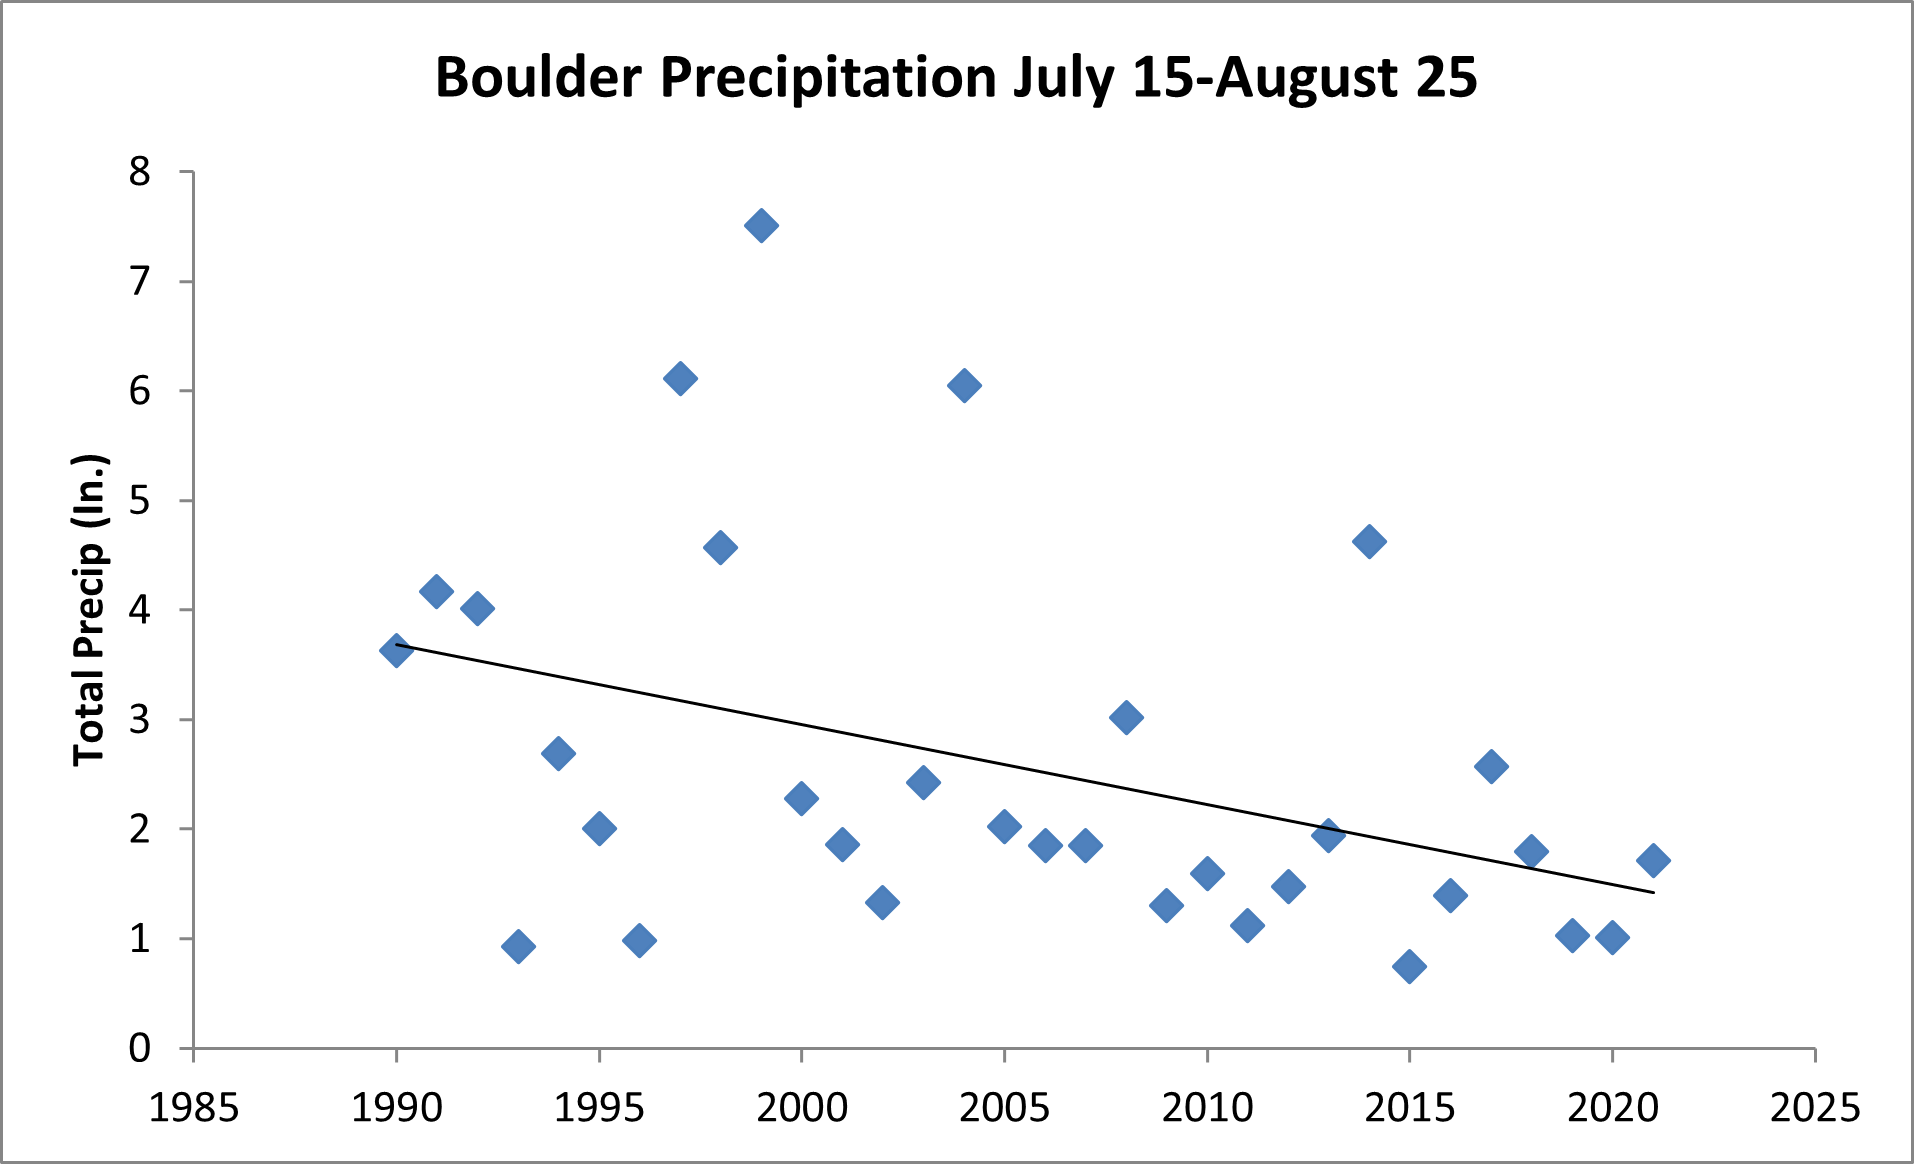
Moving from precipitation patterns to temperature, we find that summer temperatures have been trending steadily upward.
This trend is consistent with aggregate data for weather stations throughout the High Plains and Rocky Mountain region. A 2.5° F increase in just 32 years seems startling. Looking at the left side of the graph, you can see it's partially driven by the unusually cool (and wet, if you look at the previous graphs) conditions during the early 1990s. Overall records from 1897-2021 indicate a more modest 1.5° F increase in average July-August Boulder temperatures.
Will it necessarily get drier as it gets hotter? Some global warming models predict an increase in precipitation in parts of central North America, since warmer air holds more moisture. Boulder winters (December-February) already show signs of growing wetter, with four of our five snowiest winters on record having occurred since 2000. Nevertheless, hotter temperatures mean more evaporation and faster snow melt, which lead to drier conditions overall.
Other models predict that the jet stream will migrate northward, allowing fewer cold fronts to penetrate our area. Some models project a slower, more erratic flow of the jet stream leading to "stagnant waves". This is what occurred in September 2013 when a stalled low-pressure system brought 17 inches of rain to Boulder in six days and caused extensive flooding.
Because our continental climate is so erratic, it may take several more decades to see how this all plays out. Here in the West, we've already seen hotter temperatures, combined with episodes of extreme drought, spark the most intense wildfires on record.
Maybe that's why some of us are becoming so aware of variations in midsummer rainfall. Each drop seems more precious than ever.
Other August Events
Late summer rains nourish a variety of mountain mushrooms, including Boletus edulis in mountain forests and rare chanterelles (Cantharellus ciabarius). However, commercial harvesting has diminished the number of edible mushrooms in some mountain areas.
Colorful fritillary butterflies sip nectar from monarda (wild bergamot) flowers in mountain canyons before laying their eggs on wild violets.

Aphrodite fritillary. Photo by Steve Jones
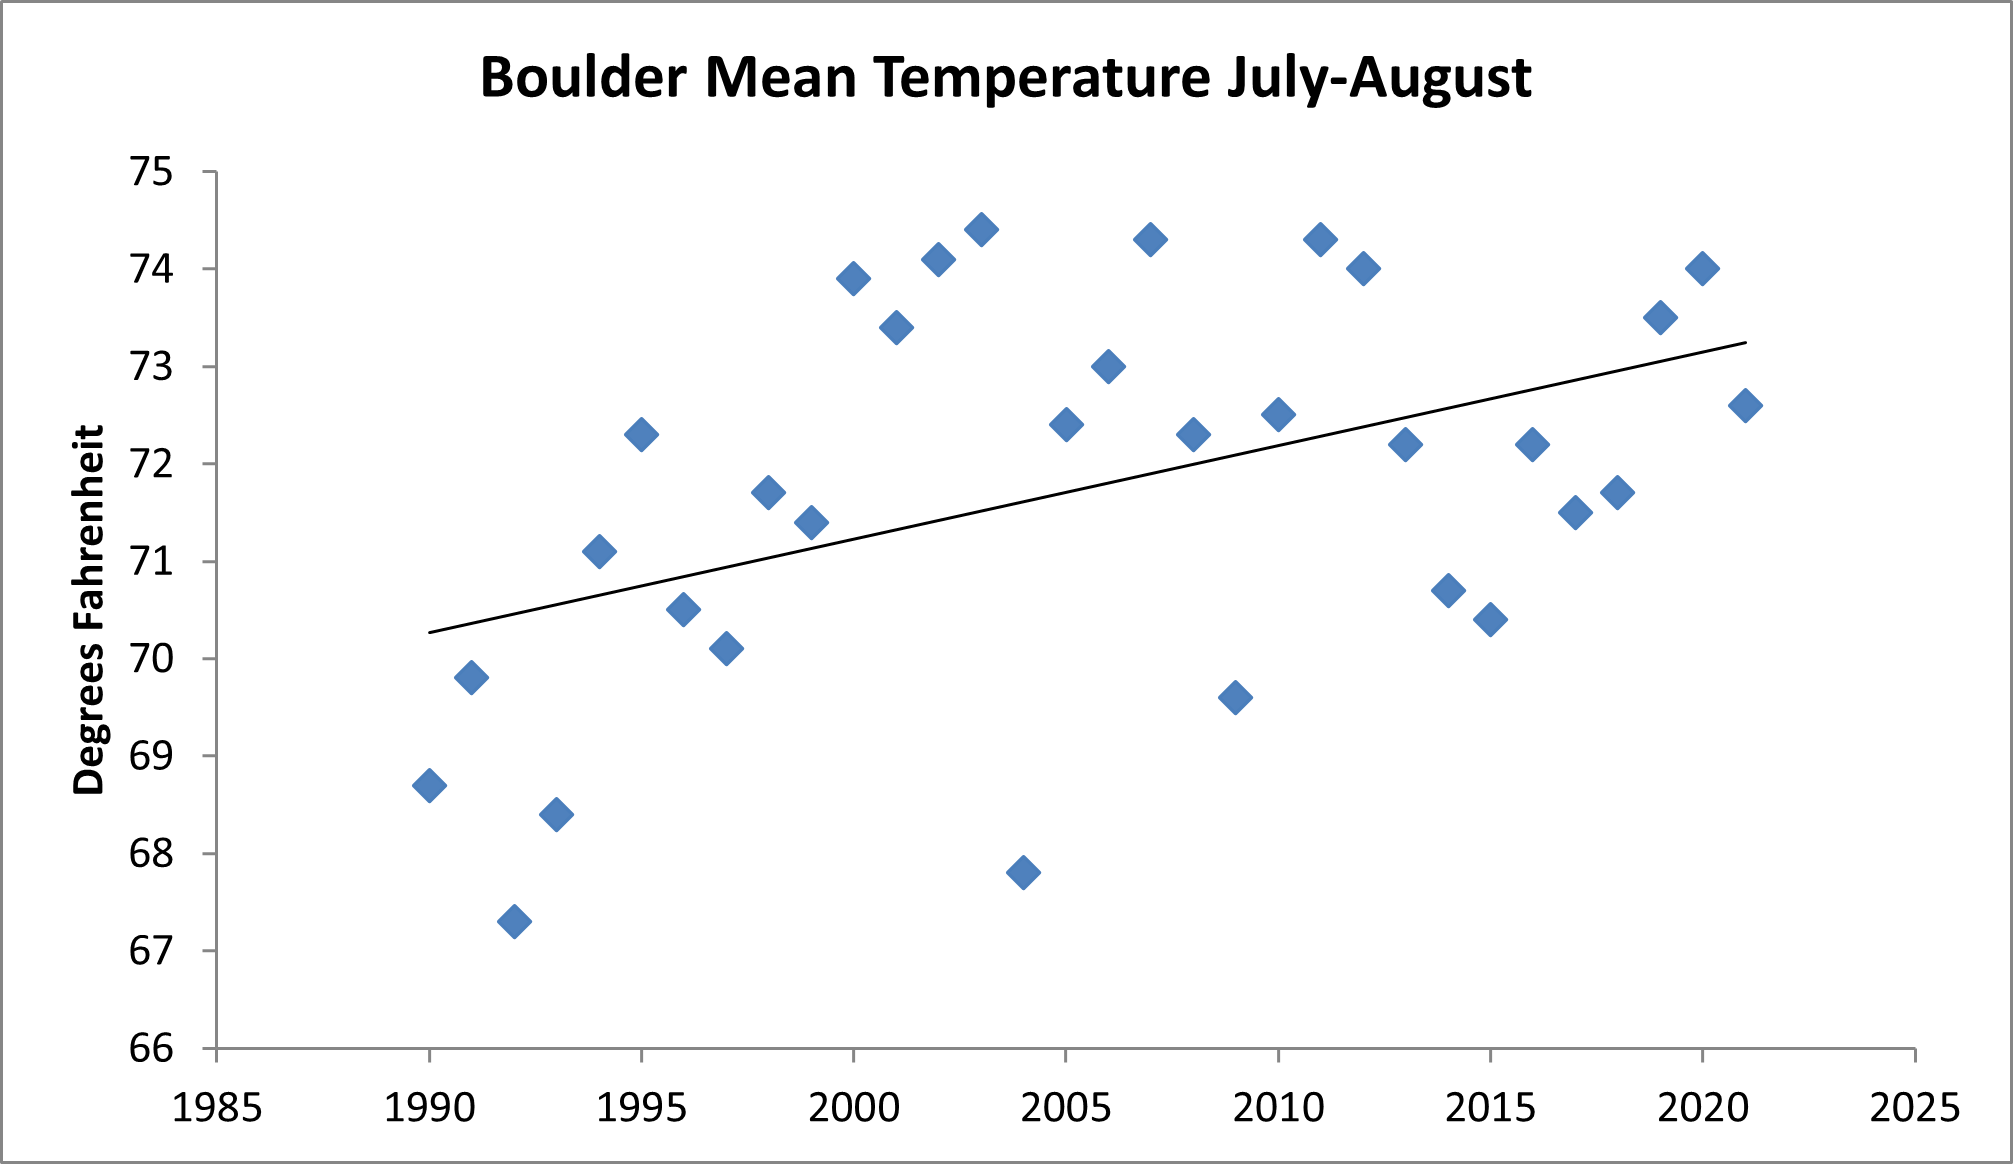
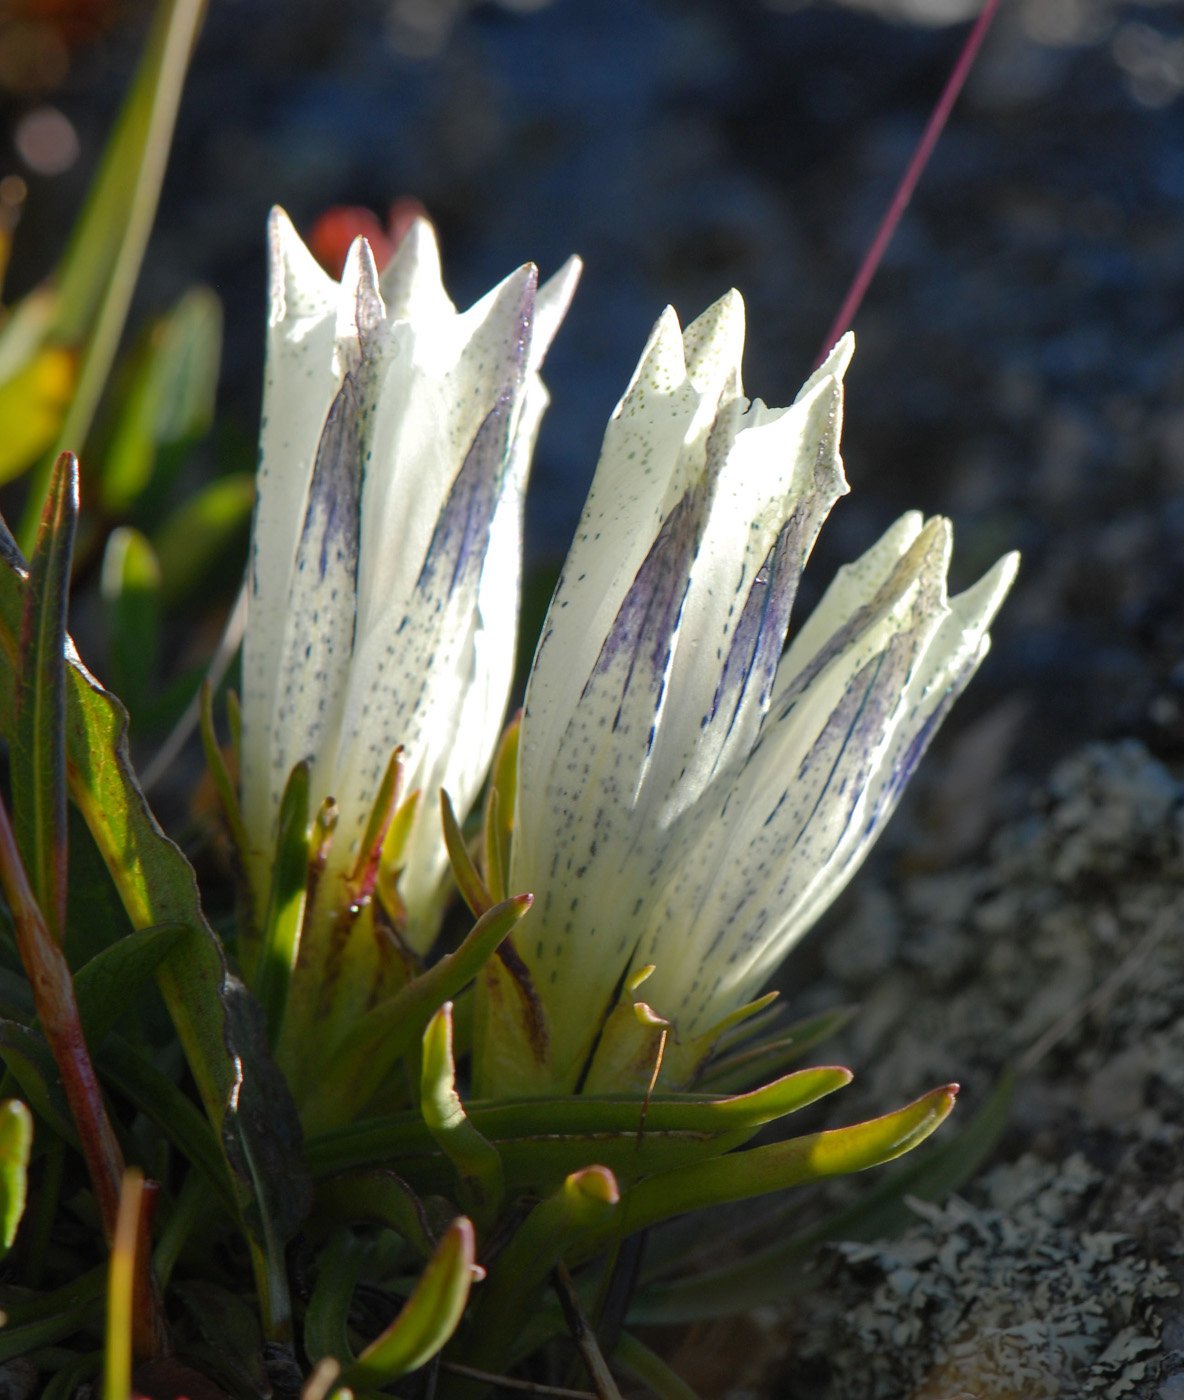
Exquisite gentians unfurl from the plains to the Alpine tundra. Look for cerulean bottle gentians (Pneumonanthe parryi, left) in mountain wetlands and striking arctic gentians (Gentianodes algida) above tree line. Photos by Stephen Jones.
Shorebird migration ramps up. Check out Hodgson-Harris Reservoir in Superior or the north shore of Union Reservoir, east of Longmont.